Total Price: $0.00
Contact Information


Hydrogen Peroxide (H2O2) Colorimetric Assay Kit
SKU: E-BC-K102-M-500
Hydrogen Peroxide (H2O2) Colorimetric Assay Kit
| SKU # | E-BC-K102-M |
| Detection Instrument | Microplate reader (402-407 nm, optimum wavelength: 405 nm) |
| Detection Method | Colorimetric method |
Product Details
Properties
| Synonyms | H2O2 |
| Sample Type | Serum, plasma, urine, tissue, cells |
| Sensitivity | 0.41 mmol/L |
| Detection Range | 0.41-125 mmol/L |
| Detection Method | Colorimetric method |
| Assay type | Quantitative |
| Assay time | 30 min |
| Precision | Average inter-assay CV: 3.600% | Average intra-assay CV: 3.200% |
| Other instruments required | Micropipettor, Centrifuge, Incubator, Vortex mixer |
| Other reagents required | Normal saline (0.9% NaCl), PBS (0.01 M, pH 7.4) |
| Storage | 2-8℃ |
| Valid period | 12 months |
Images
S Du et al investigate the promotion effect of wounds healing using programmed electric field together with minocycline. Hydrogen peroxide (H2O2) level in bacteria NB media was determined using H2O2 colorimetric assay kit (E-BC-K102-M).
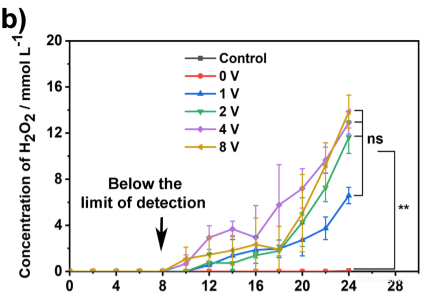
Electrical stimulation for more than 8 hours could lead to a significant increase of H2O2 in the media.
Dilution of Sample
It is recommended to take 2~3 samples with expected large difference to do pre-experiment before formal experiment and dilute the sample according to the result of the pre-experiment and the detection range (0.41-125 mmol/L).
The recommended dilution factor for different samples is as follows (for reference only):
| Sample type | Dilution factor |
| Human serum | 1 |
| Rat serum | 1 |
| Mouse serum | 1 |
| Mouse plasma | 1 |
| Porcine serum | 1 |
| Human urine | 1 |
| Cell homogenate | 1 |
| 10% Plant tissue homogenate | 1 |
| 10% Rat heart tissue homogenate | 1 |
| 10% Rat brain tissue homogenate | 1 |
| 10% Rat kidney tissue homogenate | 1 |
| 10% Rat liver tissue homogenate | 1 |
Note: The diluent is normal saline (0.9% NaCl) or PBS (0.01 M, pH 7.4).
Detection Principle
Hydrogen peroxide can react with ammonium molybdate to form a yellow complex which has a maximum absorption peak at 405 nm. H2O2 content can be calculated by measuring the absorbance value at 405 nm.
Kit Components & Storage
| Item | Component | Size 1(48 T) | Size 2(96 T) | Storage |
| Reagent 1 | Buffer Solution | 6 mL ×1 vial | 12 mL ×1 vial | 2-8°C, 12 months |
| Reagent 2 | Ammonium Molybdate Reagent | 6 mL ×1 vial | 12 mL ×1 vial | 2-8°C, 12 months |
| Reagent 3 | 1 mol/L H2O2 Standard | 1 mL ×1 vial | 1 mL ×2 vials | 2-8°C, 12 months |
| Microplate | 96 wells | No requirement | ||
| Plate Sealer | 2 pieces | |||
Note: The reagents must be stored strictly according to the preservation conditions in the above table. The reagents in different kits cannot be mixed with each other. For a small volume of reagents, please centrifuge before use, so as not to obtain sufficient amount of reagents.
Technical Data:
Parameter:
Intra-assay Precision
Three human serum samples were assayed in replicates of 20 to determine precision within an assay. (CV = Coefficient of Variation)
| Parameters | Sample 1 | Sample 2 | Sample 3 |
| Mean (mmol/L) | 5.50 | 48.60 | 102.30 |
| %CV | 3.5 | 3.1 | 3.0 |
Inter-assay Precision
Three human serum samples were assayed 20 times in duplicate by three operators to determine precision between assays.
| Parameters | Sample 1 | Sample 2 | Sample 3 |
| Mean (mmol/L) | 5.50 | 48.60 | 102.30 |
| %CV | 3.2 | 3.6 | 4.0 |
Recovery
Take three samples of high concentration, middle concentration and low concentration to test the samples of each concentration for 6 times parallelly to get the average recovery rate of 105%.
| Standard 1 | Standard 2 | Standard 3 | |
| Expected Conc. (mmol/L) | 16.5 | 55.8 | 95 |
| Observed Conc. (mmol/L) | 17.7 | 58.0 | 98.8 |
| Recovery rate (%) | 107 | 104 | 104 |
Sensitivity
The analytical sensitivity of the assay is 0.41 mmol/L. This was determined by adding two standard deviations to the mean O.D. obtained when the zero standard was assayed 20 times, and calculating the corresponding concentration.
Standard Curve
As the OD value of the standard curve may vary according to the conditions of the actual assay performance (e.g. operator, pipetting technique or temperature effects), so the standard curve and data are provided as below for reference only:
| Concentration (mmol/L) | 0 | 10 | 20 | 40 | 60 | 80 | 100 | 125 |
| OD value | 0.072 | 0.132 | 0.188 | 0.287 | 0.380 | 0.468 | 0.543 | 0.636 |
| 0.076 | 0.134 | 0.184 | 0.293 | 0.384 | 0.460 | 0.545 | 0.634 | |
| Average OD | 0.074 | 0.133 | 0.186 | 0.290 | 0.382 | 0.464 | 0.544 | 0.635 |
| Absoluted OD | 0 | 0.059 | 0.112 | 0.216 | 0.308 | 0.390 | 0.470 | 0.561 |