Total Price: $170.95
Contact Information


Lactase Activity Assay Kit
SKU: E-BC-K131-M-96
To better serve you, we would like to discuss your specific requirement.
Please Contact Us for a quote.
Lactase Activity Assay Kit
| SKU # | E-BC-K131-M |
| Detection Instrument | Microplate reader (495 nm-510 nm, optimum wavelength: 505 nm) |
| Detection Method | Colorimetric method |
Product Details
Properties
| Sample Type | Animal tissue |
| Sensitivity | 3.94 U/mL |
| Detection Range | 12.5-2000 U/mL. |
| Detection Method | Colorimetric method |
| Assay type | Enzyme Activity |
| Assay time | 60 min |
| Precision | Average inter-assay CV: 8.500% | Average intra-assay CV: 4.500% |
| Other instruments required | Micropipettor, Vortex mixer, Centrifuge, Water bath, Incubator |
| Other reagents required | Normal saline (0.9% NaCl), PBS (0.01 M, pH 7.4) |
| Storage | 2-8℃ |
| Valid period | 12 months |
Images
H M J Hees et al investigate the supplementation of oat hulls in piglets colonic microbiota development. Activity of lactase in pig jejunum was determined using lactase activity assay kit (E-BC-K131-M).
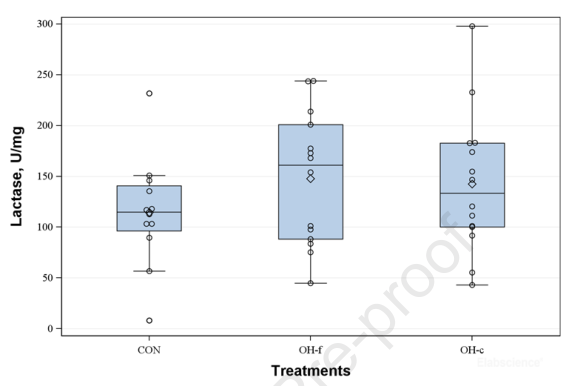
The activity of lactase in pig jejunum was significantly changed by different daily diet.
Dilution of Sample
It is recommended to take 2~3 samples with expected large difference to do pre-experiment before formal experiment and dilute the sample according to the result of the pre-experiment and the detection range (12.5-2000 U/mL).
The recommended dilution factor for different samples is as follows (for reference only):
| Sample type | Dilution factor |
| 10% Rat lleal tissue homogenate | 1 |
| 10% Rat jejunum tissue homogenate | 1 |
| 10% Rat liver tissue homogenate | 1 |
| 10% Rat kidney tissue homogenate | 1 |
Note: The diluent is normal saline (0.9% NaCl).
Detection Principle
Lactase decomposes lactose to produce glucose. Under the action of enzyme, glucose produces hydrogen peroxide. In the presence of chromogenic oxygen receptors, peroxidase catalyzes hydrogen peroxide to produce colored substances. Lactase activity can be calculated by measuring the OD value at 505 nm.
Kit Components & Storage
| Item | Component | Size (96 T) | Storage |
| Reagent 1 | Substrate | Powder ×1 vial | 2-8°C, 12 months |
| Reagent 2 | Buffer Solution | 10 mL ×1 vial | 2-8°C, 12 months |
| Reagent 3 | Stop Solution | 6 mL ×1 vial | 2-8°C, 12 months |
| Reagent 4 | Phenol Solution | 12 mL ×1 vial | 2-8°C, 12 months, shading light |
| Reagent 5 | Enzyme Solution | 12 mL ×1 vial | 2-8°C, 12 months, shading light |
| Reagent 6 | 50 mmol/L Glucose Standard Solution |
1.5 mL ×1 vial | 2-8°C, 12 months |
| 96 wells | No requirement | ||
| 2 pieces |
Note: The reagents must be stored strictly according to the preservation conditions in the above table. The reagents in different kits cannot be mixed with each other. For a small volume of reagents, please centrifuge before use, so as not to obtain sufficient amount of reagents.
Technical Data:
Parameter:
Intra-assay Precision
Three human serum samples were assayed in replicates of 20 to determine precision within an assay. (CV = Coefficient of Variation)
| Parameters | Sample 1 | Sample 2 | Sample 3 |
| Mean (U/mL) | 25.00 | 103.00 | 254.00 |
| %CV | 4.8 | 4.5 | 4.2 |
Inter-assay Precision
Three human serum samples were assayed 20 times in duplicate by three operators to determine precision between assays.
| Parameters | Sample 1 | Sample 2 | Sample 3 |
| Mean (U/mL) | 25.00 | 103.00 | 254.00 |
| %CV | 8.2 | 8.6 | 8.7 |
Recovery
Take three samples of high concentration, middle concentration and low concentration to test the samples of each concentration for 6 times parallelly to get the average recovery rate of 102%.
| Standard 1 | Standard 2 | Standard 3 | |
| Expected Conc. (mmol/L) | 4.5 | 12 | 26 |
| Observed Conc. (mmol/L) | 4.5 | 11.9 | 27.6 |
| Recovery rate (%) | 101 | 99 | 106 |
Sensitivity
The analytical sensitivity of the assay is 3.94 U/L. This was determined by adding two standard deviations to the mean O.D. obtained when the zero standard was assayed 20 times, and calculating the corresponding concentration.
Standard Curve
As the OD value of the standard curve may vary according to the conditions of the actual assay performance (e.g. operator, pipetting technique or temperature effects), so the standard curve and data are provided as below for reference only:
| Concentration (μmol/L) | 0 | 2 | 5 | 10 | 15 | 20 | 30 | 40 |
| OD value | 0.049 | 0.115 | 0.218 | 0.368 | 0.531 | 0.687 | 1.140 | 1.323 |
| 0.048 | 0.112 | 0.210 | 0.366 | 0.532 | 0.674 | 1.037 | 1.375 | |
| Average OD | 0.048 | 0.113 | 0.214 | 0.367 | 0.531 | 0.680 | 1.089 | 1.349 |
| Absoluted OD | 0.000 | 0.065 | 0.166 | 0.319 | 0.483 | 0.632 | 1.040 | 1.301 |