

ATP Colorimetric Assay Kit
SKU: E-BC-K157-S-100
ATP Colorimetric Assay Kit
| SKU # | E-BC-K157-S |
| Detection Instrument | Spectrophotometer (636 nm) |
| Detection method | Colorimetric method |
Product Details
Properties
| Synonyms | ATP |
| Sample Type | Tissue |
| Sensitivity | 0.01 mmol/L |
| Detection Range | 0.01-1.5 mmol/L |
| Detection Method | Colorimetric method |
| Assay type | Quantitative |
| Assay time | 70 min |
| Precision | Average inter-assay CV: 9.300% | Average intra-assay CV: 3.600% |
| Other instruments required | Micropipettor, Incubator, Water bath, Vortex mixer, Centrifuge |
| Storage | Reagent 4:-20℃; Others:2-8℃ |
| Valid period | 12 months |
Images
S Arora et al found that miR-495-3p regulates the mitophagy and apoptosis in NSCLC through Sphk1. ATP level in NSCLC was determined using ATP colorimetric assay kit (E-BC-K157-S).
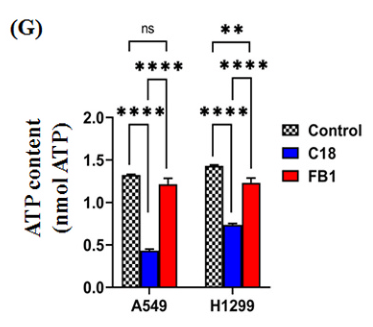
ATP level was reduced significantly upon cells with C18 ceramide and restored with FB1. (***P<0.001, ****P<0.0001)
Dilution of Sample
It is recommended to take 2~3 samples with expected large difference to do pre-experiment before formal experiment and dilute the sample according to the result of the pre-experiment and the detection range (0.01-1.5 mmol/L).
The recommended dilution factor for different samples is as follows (for reference only):
| Sample type | Dilution factor |
| 10% Rat muscle tissue homogenate | 2-3 |
| 10% Rat liver tissue homogenate | 2-3 |
| 10% Mouse brain tissue homogenate | 2-3 |
| 10% Rat kidney tissue homogenate | 2-3 |
| 10% Rat lung tissue homogenate | 2-3 |
Note: The diluent is deionized water.
Detection Principle
Creatine Kinase catalyzes adenosine triphosphate and creatine to produce creatine phosphate, then detected by phosphomolybdic acid colorimetry.
Kit Components & Storage
| Item | Component |
Size 1 (50 Assays) |
Size 2 (100 Assays) |
Storage |
| Reagent 1 | Extraction Solution |
30 mL × 1 vial | 60 mL × 1 vial | 2-8°C, 12 months |
| Reagent 2 | Substrate | Powder × 1 vial | Powder × 2 vials | 2-8°C, 12 months |
| Reagent 3 | Buffer Solution | 12 mL × 1 vial | 24 mL × 1 vial | 2-8°C, 12 months |
| Reagent 4 | Enzyme Reagent | Powder × 1 vial | Powder × 2 vials | -20°C, 12 months |
| Reagent 5 | Protein Precipitator | 3 mL × 1 vial | 6 mL × 1 vial | 2-8°C, 12 months |
| Reagent 6 | Chromogenic Agent A | 24 mL × 1 vial | 48 mL × 1 vial | 2-8°C, 12 months, shading light |
| Reagent 7 | Chromogenic Agent B | 8 mL × 1 vial | 16 mL × 1 vial | 2-8°C, 12 months |
| Reagent 8 | Stop Solution | 30 mL× 1 vial | 60 mL× 1 vial | 2-8°C, 12 months |
| Reagent 9 | Standard | Powder × 2 vials | Powder × 4 vials | 2-8°C, 12 months |
Note: The reagents must be stored strictly according to the preservation conditions in the above table. The reagents in different kits cannot be mixed with each other. For a small volume of reagents, please centrifuge before use, so as not to obtain sufficient amount of reagents
Technical Data:
Parameter:
Intra-assay Precision
Three rat liver tissue samples were assayed in replicates of 20 to determine precision within an assay. (CV = Coefficient of Variation)
| Parameters | Sample 1 | Sample 2 | Sample 3 |
| Mean (mmol/L) | 0.47 | 0.95 | 1.20 |
| %CV | 3.7 | 3.6 | 3.5 |
Inter-assay Precision
Three rat liver tissue samples were assayed 20 times in duplicate by three operators to determine precision between assays.
| Parameters | Sample 1 | Sample 2 | Sample 3 |
| Mean (mmol/L) | 0.47 | 0.95 | 1.20 |
| %CV | 9.2 | 8.7 | 10.0 |
Recovery
Take three samples of high concentration, middle concentration and low concentration to test the samples of each concentration for 6 times parallelly to get the average recovery rate of 103%.
| Standard 1 | Standard 2 | Standard 3 | |
| Expected Conc. (mmol/L) | 0.65 | 1.05 | 1.35 |
| Observed Conc. (mmol/L) | 0.7 | 1.0 | 1.4 |
| Recovery rate (%) | 106 | 98 | 105 |
Sensitivity
The analytical sensitivity of the assay is 0.01 mmol/L. This was determined by adding two standard deviations to the mean O.D. obtained when the zero standard was assayed 20 times, and calculating the corresponding concentration.
Standard Curve
As the OD value of the standard curve may vary according to the conditions of the actual assay performance (e.g. operator, pipetting technique or temperature effects), so the standard curve and data are provided as below for reference only.
| Concentration (mmol/L) | 0 | 0.1 | 0.2 | 0.4 | 0.8 | 1 | 1.5 | 0 |
| Average OD | 0.030 | 0.078 | 0.136 | 0.240 | 0.441 | 0.534 | 0.743 | 0.030 |
| Absoluted OD | 0 | 0.048 | 0.106 | 0.210 | 0.411 | 0.504 | 0.713 | 0 |