Total Price: $0.00
Contact Information


Copper (Cu) Colorimetric Assay Kit
SKU: E-BC-K300-M-500
Copper (Cu) Colorimetric Assay Kit
| SKU # | E-BC-K300-M |
| Detection Instrument | Microplate reader (575-585 nm) |
| Detection method | Colorimetric method |
Product Details
Properties
| Synonyms | Cu |
| Sample type |
Serum, plasma, tissue |
| Sensitivity | 1.84 μmol/L |
| Detection range | 1.84-60 μmol/L |
| Detection Method | Colorimetric method |
| Assay type | Quantitative |
| Assay time | 30 min |
| Precision | Average inter-assay CV: 3.100% | Average intra-assay CV: 3% |
| Other instruments required | Micropipettor, Incubator |
| Storage | 2-8℃ |
| Valid period | 12 months |
Images
N Yang et al investigate the seizure-induced neurotoxicity revealed by D-penicillamine. Copper (Cu) levels in mouse brain were determined using copper colorimetric assay kit (E-BC-K300-M).
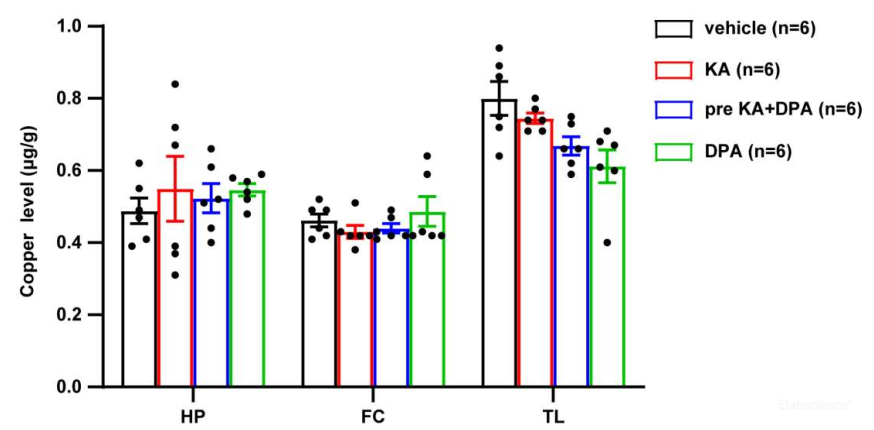
No significant difference was observed in hippocampus, frontal cortex and thalamus in mice subject to KA when treatment with DPA, compared with vehicle group.
Dilution of Sample
It is recommended to take 2~3 samples with expected large difference to do pre-experiment before formal experiment and dilute the sample according to the result of the pre-experiment and the detection range (1.84-60 μmol/L).
The recommended dilution factor for different samples is as follows (for reference only):
| Sample type | Dilution factor |
| Human serum | 1 |
| Human plasma | 1 |
| Dog serum | 1 |
| Rat serum | 1 |
| Rabbit serum | 1 |
| Porcine serum | 1 |
Note: The diluent is double distilled water.
Detection Principle
In acidic condition, the copper ion in the sample react with 3,5-DiBr-PAESA to form a purple complex which has a maximum absorption peak at 580 nm. And copper ion content can be calculated indirectly by measuring the OD value at 580 nm.
Kit Components & Storage
| Item | Component | Size 1 (48 T) | Size 2 (96 T) | Storage |
| Reagent 1 | Chromogenic Agent A | 17.5 mL × 1 vial | 35 mL × 1 vial | 2-8°C, 12 months shading light |
| Reagent 2 | Chromogenic Agent B | Powder × 1 vial | Powder × 2 vials | 2-8°C, 12 months shading light |
| Reagent 3 | 100 μmol/L Copper Standard | 1 mL × 1 vial | 1 mL × 1 vial | 2-8°C, 12 months |
| Microplate | 96 wells | No requirement | ||
| Plate Sealer | 2 pieces | |||
Note: The reagents must be stored strictly according to the preservation conditions in the above table. The reagents in different kits cannot be mixed with each other. For a small volume of reagents, please centrifuge before use, so as not to obtain sufficient amount of reagents.
Technical Data:
Parameter:
Intra-assay Precision
Three human serum samples were assayed in replicates of 20 to determine precision within an assay. (CV = Coefficient of Variation)
| Parameters | Sample 1 | Sample 2 | Sample 3 |
| Mean (μmol/L) | 4.80 | 26.70 | 52.00 |
| %CV | 3.5 | 3.0 | 2.5 |
Inter-assay Precision
Three human serum samples were assayed 17 times in duplicate by three operators to determine precision between assays.
| Parameters | Sample 1 | Sample 2 | Sample 3 |
| Mean (μmol/L) | 4.80 | 26.70 | 52.00 |
| %CV | 2.8 | 3.2 | 3.3 |
Recovery
Take three samples of high concentration, middle concentration and low concentration to test the samples of each concentration for 6 times parallelly to get the average recovery rate of 105%.
| Parameters | Standard 1 | Standard 2 | Standard 3 |
| Expected Conc. (μmol/L) | 7.5 | 28.5 | 48.2 |
| Observed Conc. (μmol/L) | 7.6 | 30.5 | 51.6 |
| Recovery rate (%) | 101 | 107 | 107 |
Sensitivity
The analytical sensitivity of the assay is 1.84 μmol/L. This was determined by adding two standard deviations to the mean O.D. obtained when the zero standard was assayed 20 times, and calculating the corresponding concentration.
Standard Curve
As the OD value of the standard curve may vary according to the conditions of the actual assay performance (e.g. operator, pipetting technique or temperature effects), so the standard curve and data are provided as below for reference only:
|
Concentration (μmol/L) |
0 | 5 | 10 | 20 | 30 | 40 | 50 | 60 |
| Average OD | 0.102 | 0.122 | 0.147 | 0.196 | 0.241 | 0.281 | 0.331 | 0.365 |
| Absoluted OD | 0 | 0.020 | 0.046 | 0.094 | 0.139 | 0.179 | 0.230 | 0.264 |