Total Price: $0.00
Contact Information


Ferrous Iron Colorimetric Assay Kit
SKU: E-BC-K304-S-100
To better serve you, we would like to discuss your specific requirement.
Please Contact Us for a quote.
Ferrous Iron Colorimetric Assay Kit
| SKU # | E-BC-K304-S |
| Detection Instrument | Spectrophotometer (520 nm) |
| Detection method | Colorimetric method |
Product Details
Properties
| Sample type | Serum, plasma, animal tissue |
| Sensitivity | 0.08 mg/L |
| Detection range | 0.08-20 mg/L |
| Detection Method | Colorimetric method |
| Assay type | Quantitative |
| Assay time | 45 min |
| Precision | Average inter-assay CV: 3.200% | Average intra-assay CV: 3% |
| Other instruments required | Test tubes, Vortex Mixer, Centrifuge, Water bath, Test tubes, Vortex Mixer, Centrifuge, Water bath |
| Storage | 2-8℃ |
| Valid period | 12 months |
Images
T Tong et al developed a novel ferrous sulfide nanoparticles for inhibiting porcine reproductive and respiratory syndrome virus. Ferrous ion levels in cell were determined using ferrous ion colorimetric assay kit (E-BC-K304-S).
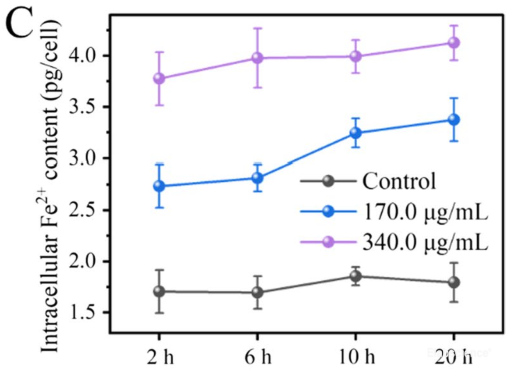
The administration of Fe nanoparticle significantly increased the ferrous level in cells with dose dependent.
Dilution of Sample
It is recommended to take 2~3 samples with expected large difference to do pre-experiment before formal experiment and dilute the sample according to the result of the pre-experiment and the detection range (0.08-50 mg/L).
The recommended dilution factor for different samples is as follows (for reference only):
| Sample type | Dilution factor |
| Human plasma | 1 |
| Human serum | 1 |
| 10% Rat liver tissue homogenate | 1 |
| 10% Epipremnum aureum homogenate | 1 |
Note: The diluent is double distilled water).
Detection Principle
Under the action of acidic solution and reductant, ferric ions can be separated from transferrin in serum, and reduced into ferrous ions (Fe2+). The latter then bind to bipyridine and form pink complexes. The concentration of iron can be calculated by measuring the OD value at 520 nm indirectly.
Kit Components & Storage
| Item | Component |
Size 1 (50 assays) |
Size 2 (100 assays) |
Storage |
| Reagent 1 | FeSO4·7H2O Power | Powder × 1 vial | Powder × 2 vial | 2-8°C, 12 months shading light |
| Reagent 2 | Chromogenic Agent A | Powder × 2 vials | Powder × 4 vials | 2-8°C, 12 months shading light |
| Reagent 3 | Chromogenic Agent B | 50 mL × 2 vials | 50 mL × 4 vials | 2-8°C, 12 months |
Note: The reagents must be stored strictly according to the preservation conditions in the above table. The reagents in different kits cannot be mixed with each other. For a small volume of reagents, please centrifuge before use, so as not to obtain sufficient amount of reagents
Technical Data:
Parameter:
Intra-assay Precision
Three human serum samples were assayed in replicates of 20 to determine precision within an assay. (CV = Coefficient of Variation)
| Parameters | Sample 1 | Sample 2 | Sample 3 |
| Mean (mg/L) | 1.50 | 9.70 | 13.20 |
| %CV | 3.4 | 2.9 | 2.7 |
Inter-assay Precision
Three human serum samples were assayed 17 times in duplicate by three operators to determine precision between assays.
| Parameters | Sample 1 | Sample 2 | Sample 3 |
| Mean (mg/L) | 1.50 | 9.70 | 13.20 |
| %CV | 2.9 | 3.3 | 3.4 |
Recovery
Take three samples of high concentration, middle concentration and low concentration to test the samples of each concentration for 6 times parallelly to get the average recovery rate of 97%.
| Parameters | Standard 1 | Standard 2 | Standard 3 |
| Expected Conc. (mg/L) | 2.5 | 11.6 | 17.4 |
| Observed Conc. (mg/L) | 2.5 | 11.0 | 16.9 |
| Recovery rate (%) | 99 | 95 | 97 |
Sensitivity
The analytical sensitivity of the assay is 0.08 mg/L. This was determined by adding two standard deviations to the mean O.D. obtained when the zero standard was assayed 20 times, and calculating the corresponding concentration.
Standard Curve
As the OD value of the standard curve may vary according to the conditions of the actual assay performance (e.g. operator, pipetting technique or temperature effects), so the standard curve and data are provided as below for reference only:
|
Concentration (μmol/L) |
0 | 2 | 4 | 5 | 10 | 15 | 20 |
| Average OD | 0.000 | 0.040 | 0.062 | 0.097 | 0.179 | 0.271 | 0.377 |
| Absoluted OD | 0.000 | 0.040 | 0.062 | 0.097 | 0.179 | 0.271 | 0.377 |