Quantity
Price
$102.95
Total Price: $0.00
Contact Information


Triglyceride (TG) Colorimetric Assay Kit (Single Reagent, GPO-PAP Method)
SKU: E-BC-K261-M-500
Triglyceride (TG) Colorimetric Assay Kit (Single Reagent, GPO-PAP Method)
| SKU # | E-BC-K261-M |
| Detection Instrument | Microplate reader (510 nm) |
| Detection method | Colorimetric method |
Product Details
Properties
| Synonyms | TG |
| Sample type | Serum, plasma and tissue |
| Sensitivity | 0.14 mmol/L |
| Detection range | 0.14-10 mmol/L |
| Detection Method | Colorimetric method |
| Assay type | Quantitative |
| Assay time | 30min |
| Precision | Average inter-assay CV: 9.200% | Average intra-assay CV: 4.100% |
| Other instruments required | Micropipettor, Water bath, Incubator, Vortex mixer, Centrifuge |
| Other reagents required |
Normal saline (0.9% NaCl), PBS (0.01 M, pH 7.4), Isopropanol(AR),Anhydrous ethanol |
| Storage | 2-8℃ |
| Valid period | 12 months |
Images
Y Gao et al developed a lipopeptide nanoplexes for atorvastatin transformation. Triglyceride (TG) level in mouse B16-F10 and CT-26 cell was determined using TG colorimetric assay kit (E-BC-K261-M).
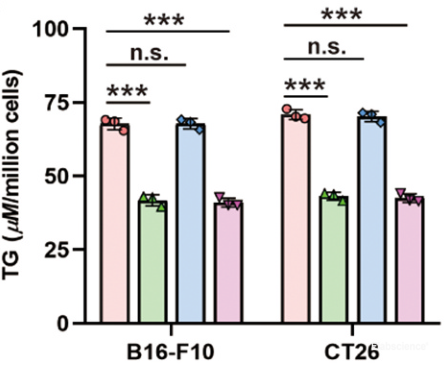
Triglyceride level in cells were significantly reduced by atorvastatin treatment (***P<0.001)
Dilution of Sample
It is recommended to take 2~3 samples with expected large difference to do pre-experiment before formal experiment and dilute the sample according to the result of the pre-experiment and the detection range (0.14-10 mmol/L).
The recommended dilution factor for different samples is as follows (for reference only):
| Sample type | Dilution factor |
| Human serum | 1 |
| Mouse serum | 1 |
| Rat plasma | 1 |
| 10% Mouse liver tissue homogenate | 1 |
| 10% Mouse kidney tissue homogenate | 1 |
| 10% Mouse heart tissue homogenate | 1 |
Note: The diluent is normal saline (0.9% NaCl) or PBS (0.01 M, pH 7.4) for serum (plasma) samples; The diluent is anhydrous ethanol for tissue samples.
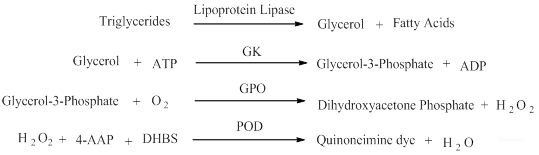
Detection Principle
Triglycerides (TG) can be hydrolyzed by lipoprotein lipase into glycerol and free fatty acids. Glycerol produces glycerol-3-phosphate and ADP under the catalysis of glycerol kinase (GK). Glycerol-3-phosphate produces hydrogen peroxide under the action of glycerol phosphate oxidase (GPO). In the presence of 4-aminoantipyrine and phenol, hydrogen peroxide is catalyzed by peroxidase (POD) to produce quinones which is proportional to the content of TG.
Kit Components & Storage
| Item | Component | Size 1 (96 T) | Size 2 (500 Assays) | Storage |
| Reagent 1 | Enzyme Working Solution | 25 mL ×1 vial | 50 mL ×3 vials | 2-8°C, 12 months shading light |
| Reagent 2 | 2.26 mmol/L Glycerinum Standard | 0.1 mL × 1 vial | 0.1 mL × 5 vials | 2-8°C, 12 months shading light |
| Microplate | 96 wells | No requirement | ||
| Plate Sealer | 2 pieces |
Note: The reagents must be stored strictly according to the preservation conditions in the above table. The reagents in different kits cannot be mixed with each other. For a small volume of reagents, please centrifuge before use, so as not to obtain sufficient amount of reagents.
Technical Data:
Parameter:
Intra-assay Precision
Three human serum samples were assayed in replicates of 20 to determine precision within an assay. (CV = Coefficient of Variation)
| Parameters | Sample 1 | Sample 2 | Sample 3 |
| Mean (mmol/L) | 0.50 | 2.60 | 7.40 |
| %CV | 4.6 | 4.1 | 3.6 |
Inter-assay Precision
Three human serum samples were assayed 17 times in duplicate by three operators to determine precision between assays.
| Parameters | Sample 1 | Sample 2 | Sample 3 |
| Mean (mmol/L) | 0.50 | 2.60 | 7.40 |
| %CV | 9.1 | 8.5 | 10.0 |
Recovery
Take three samples of high concentration, middle concentration and low concentration to test the samples of each concentration for 6 times parallelly to get the average recovery rate of 105%.
| Parameters | Sample 1 | Sample 2 | Sample 3 |
| Expected Conc. (mmol/L) | 1.6 | 3.7 | 8.5 |
| Observed Conc. (mmol/L) | 1.7 | 3.8 | 9.3 |
| Recovery rate (%) | 104 | 102 | 109 |
Sensitivity
The analytical sensitivity of the assay is 0.14 mmol/L. This was determined by adding two standard deviations to the mean O.D. obtained when the zero standard was assayed 20 times, and calculating the corresponding concentration.
Standard Curve
As the OD value of the standard curve may vary according to the conditions of the actual assay performance (e.g. operator, pipetting technique or temperature effects), so the standard curve and data are provided as below for reference only:
|
Concentration (mmol/L) |
0 | 1 | 2 | 4 | 5 | 6 | 8 | 10 |
| Average OD | 0.084 | 0.219 | 0.332 | 0.635 | 0.752 | 0.874 | 1.144 | 1.375 |
| Absoluted OD | 0 | 0.135 | 0.248 | 0.551 | 0.669 | 0.790 | 1.060 | 1.292 |