Total Price: $0.00
Contact Information


Glutathione Reductase (GR) Activity Assay Kit
SKU: E-BC-K099-S-100
To better serve you, we would like to discuss your specific requirement.
Please Contact Us for a quote.
Glutathione Reductase (GR) Activity Assay Kit
| SKU # | E-BC-K099-S |
| Detection Instrument | Spectrophotometer (340 nm) |
| Detection Method | Colorimetric method |
Product Details
Properties
| Synonyms | GR |
| Sample Type | Serum,plasma,tissue,cells |
| Sensitivity | 6.2 U/L |
| Detection Range | 6.2-320 U/L |
| Detection Method | Colorimetric method |
| Assay type | Enzyme Activity |
| Assay time | 90 min |
| Precision | Average inter-assay CV: 2.500% | Average intra-assay CV: 2.100% |
| Other instruments required | Incubator, Vortex mixer, Micropipettor, Centrifuge |
| Other reagents required | Normal saline (0.9% NaCl), PBS (0.01 M, pH 7.4) |
| Storage | Reagent 1: 2-8℃, others: -20℃ |
| Valid period | 12 months |
Images
N Abdollahzade et al found that melatonin attenuated oxidative DNA damage in rats and attenuate chronic arsenic neurotoxicity. Glutathione reductase (GR) activity of rat brain tissue was determined using GR activity assay kit (E-BC-K099-S).
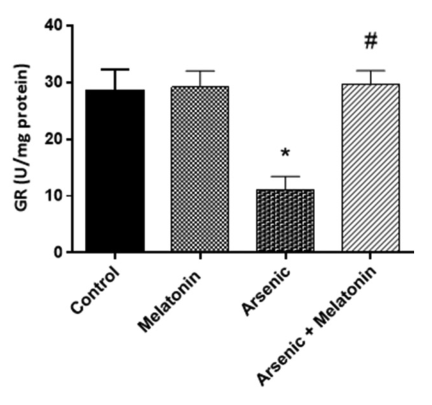
The activity of GR was significantly lower (*P<0.05) in arsenic treated group and increased in arsenic + melatonin group (#P<0.05) comparing to control.
Dilution of Sample
It is recommended to take 2~3 samples with expected large difference to do pre-experiment before formal experiment and dilute the sample according to the result of the pre-experiment and the detection range (6.2-320 U/L).
The recommended dilution factor for different samples is as follows (for reference only):
| Sample type | Dilution factor |
| Human serum | 1 |
| Human plasma | 1 |
| Mouse serum | 1 |
| Mouse plasma | 1 |
| Rat serum | 1 |
| Rat plasma | 1 |
| 10% Mouse liver tissue homogenization | 1-5 |
| 10% Epipremnum aureum tissue homogenization | 1 |
Note: The diluent is double distilled water or MERGEFIELD 其他试剂 normal saline (0.9% NaCl).
Detection Principle
With the coenzyme as hydrogen donor, GSSG can be reduced to GSH under the catalysis of GR. Then the GSH content increased and NADPH decreased. The decrease of NADPH absorbance can be measured at 340 nm. The activity of GR can be calculated by detecting the change of NADPH.
![]()
Kit Components & Storage
| Item | Component |
Size 1 (50 assays) |
Size 2 (100 assays) |
Storage |
| Reagent 1 | Buffer Solution | 60 mL × 3 vials | 60 mL × 6 vials | 2-8℃, 12 months |
| Reagent 2 | Substrate | Powder ×4 vials | Powder × 8 vials | -20℃, 12 month |
| Reagent 3 | Enzyme Reagent | Powder × 2 vials | Powder × 4 vials | -20℃, 12 month |
Note: The reagents must be stored strictly according to the preservation conditions in the above table. The reagents in different kits cannot be mixed with each other. For a small volume of reagents, please centrifuge before use, so as not to obtain sufficient amount of reagents.
Technical Data:
Parameter:
Intra-assay Precision
Three human serum samples were assayed in replicates of 20 to determine precision within an assay (CV = Coefficient of Variation).
| Parameters | Sample 1 | Sample 2 | Sample 3 |
| Mean (U/L) | 15.50 | 148.00 | 243.50 |
| %CV | 2.3 | 1.8 | 2.2 |
Inter-assay Precision
Three human serum samples were assayed 20 times in duplicate by three operators to determine precision between assays.
| Parameters | Sample 1 | Sample 2 | Sample 3 |
| Mean (U/L) | 15.50 | 148.00 | 243.50 |
| %CV | 2.4 | 2.6 | 2.5 |
Recovery
Take three samples of high concentration, middle concentration and low concentration to test the samples of each concentration for 6 times parallelly to get the average recovery rate of 100%.
| Sample 1 | Sample 2 | Sample 3 | |
| Expected Conc. (U/L) | 85.4 | 168.5 | 262 |
| Observed Conc. (U/L) | 84.5 | 165.1 | 269.9 |
| Recovery rate (%) | 99 | 98 | 103 |
Sensitivity
The analytical sensitivity of the assay is 6.2 U/L. This was determined by adding two standard deviations to the mean O.D. obtained when the zero standard was assayed 20 times, and calculating the corresponding concentration.
Standard Curve
As the OD value of the standard curve may vary according to the conditions of the actual assay performance (e.g. operator, pipetting technique or temperature effects), so the standard curve and data are provided as below for reference only:
| Concentration (U/L) | 0 | 40 | 100 | 160 | 200 | 280 | 320 | 8.0 |
| Average OD | 0.137 | 0.286 | 0.410 | 0.634 | 0.759 | 0.840 | 0.948 | 1.058 |
| Absoluted OD | 0.000 | 0.149 | 0.273 | 0.497 | 0.622 | 0.703 | 0.811 | 0.921 |