Quantity
Price
$84.00
Total Price: $0.00
Contact Information


Total Antioxidant Capacity (T-AOC) Colorimetric Assay Kit (FRAP Method)
SKU: E-BC-K225-M-500
Total Antioxidant Capacity (T-AOC) Colorimetric Assay Kit (FRAP Method)
| SKU # | E-BC-K225-M |
| Detection Instrument | Microplate reader (590-600 nm) |
| Detection method | Colorimetric method |
Product Details
Properties
| Synonyms | T-AOC |
| Sample Type | Serum, plasma, saliva, urine, tissue, cells, cell culture supernatant |
| Sensitivity | 0.049 mmol/L |
| Detection Range | 0.049-2.5 mmol/L |
| Detection Method | Colorimetric method |
| Assay type | Quantitative |
| Assay time | 20 min |
| Precision | Average inter-assay CV: 8.100% | Average intra-assay CV: 3.900% |
| Other instruments required | Balance, Incubator, Micropipettor |
| Other reagents required | Normal saline (0.9% NaCl), PBS (0.01 M, pH 7.4) |
| Storage | 2-8℃ |
| Valid period | 12 months |
Images
D Shanmugarajan et al investigate the antihypertensive and pleiotropic effect of Phyllanthus emblica extract. Total antioxidant capacity (T-AOC) in human serum was determined using T-AOC colorimetric assay kit (E-BC-K225-M).
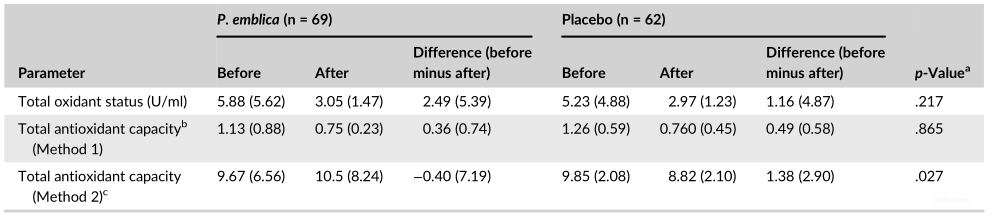
No significant difference in total oxidant status between Phyllanthus emblica group and placebo group can be seen.
Dilution of Sample
It is recommended to take 2~3 samples with expected large difference to do pre-experiment before formal experiment and dilute the sample according to the result of the pre-experiment and the detection range (0.049-2.5 mmol/L).
The recommended dilution factor for different samples is as follows (for reference only):
| Sample type | Dilution factor |
| Human serum | 1 |
| Human saliva | 1 |
| Human urine | 1 |
| Cellular supernatant | 1 |
| HepG2 cells homogenization | 1 |
| 5% Mouse liver tissue homogenization | 1 |
| 10% Epipremnum aureum tissue homogenization | 1 |
Note: The diluent is normal saline (0.9% NaCl) or PBS (0.01 M, pH 7.4).
Detection Principle
Fe3+-TPTZ can be reduced by antioxidants and produce blue Fe2+-TPTZ under acid condition. The antioxidant capacity of sample can be calculated by detection the absorbance value at 593 nm.
Kit Components & Storage
| Item | Component | Size 1(48 T) | Size 2(96 T) | Storage |
| Reagent 1 | Buffer Solution | 10 mL × 1 vial | 20 mL × 1 vial | 2-8℃, 12 months |
| Reagent 2 | TPTZ Solution | 1 mL × 1 vial | 2 mL × 1 vial | 2-8°C, 12 months, shading light |
| Reagent 3 | Substrate Solution | 1 mL × 1 vial | 2 mL × 1 vial | 2-8℃, 12 months shading light |
| Reagent 4 | FeSO4•7H2O Standard |
100 mg × 1 vial | 200 mg × 1 vial | 2-8℃, 12 months |
| Microplate | 96 wells | No requirement | ||
| Plate Sealer | 2 pieces | |||
Note: The reagents must be stored strictly according to the preservation conditions in the above table. The reagents in different kits cannot be mixed with each other. For a small volume of reagents, please centrifuge before use, so as not to obtain sufficient amount of reagents.
Technical Data:
Parameter:
Intra-assay Precision
Three human serum samples were assayed in replicates of 20 to determine precision within an assay (CV = Coefficient of Variation).
| Parameters | Sample 1 | Sample 2 | Sample 3 |
| Mean (mmol/L) | 0.58 | 1.02 | 1.95 |
| %CV | 4.3 | 4.0 | 3.4 |
Inter-assay Precision
Three human serum samples were assayed 20 times in duplicate by three operators to determine precision between assays.
| Parameters | Sample 1 | Sample 2 | Sample 3 |
| Mean (mmol/L) | 0.58 | 1.02 | 1.95 |
| %CV | 7.6 | 8.4 | 8.3 |
Recovery
Take three samples of high concentration, middle concentration and low concentration to test the samples of each concentration for 6 times parallelly to get the average recovery rate of 103%.
| Standard 1 | Standard 2 | Standard 3 | |
| Expected Conc. (mmol/L) | 0.5 | 1.1 | 2 |
| Observed Conc. (mmol/L) | 0.5 | 1.2 | 2.1 |
| Recovery rate (%) | 101 | 105 | 103 |
Sensitivity
The analytical sensitivity of the assay is 0.049 mmol/L. This was determined by adding two standard deviations to the mean O.D. obtained when the zero standard was assayed 20 times, and calculating the corresponding concentration.
Standard Curve
As the OD value of the standard curve may vary according to the conditions of the actual assay performance (e.g. operator, pipetting technique or temperature effects), so the standard curve and data are provided as below for reference only:
| Concentration (mmol/L) | 0 | 0.3 | 0.6 | 0.9 | 1.2 | 1.8 | 2.1 |
| Average OD | 0.070 | 0.160 | 0.253 | 0.356 | 0.423 | 0.618 | 0.708 |
| Absoluted OD | 0 | 0.090 | 0.184 | 0.287 | 0.354 | 0.548 | 0.639 |