Total Price: $0.00
Contact Information


Total Phenols Colorimetric Assay Kit (Plant samples)
SKU: E-BC-K354-M-500
Total Phenols Colorimetric Assay Kit (Plant samples)
| SKU # | E-BC-K354-M |
| Detection Instrument | Microplate reader (750 nm-770 nm, optimum wavelength: 760 nm) |
| Detection method | Colorimetric method |
Product Details
Properties
| Sample type | Plant tissue |
| Sensitivity | 1.05 μg/mL |
| Detection range | 1.05–148 μg/mL |
| Detection Method | Colorimetric method |
| Assay type | Quantitative |
| Assay time | 35 min |
| Precision | Average inter-assay CV: 4.400% | Average intra-assay CV: 4.100% |
| Other instruments required | Incubator, Vacuum drying oven, Centrifuge |
| Other reagents required | 60% alcohol |
| Storage | 2-8℃ |
| Valid period | 12 months |
Images
JH Kim et al investigate the bisphenol A-induced inflammation and cytotoxicity blocked by Grifola frondosa extract. Total phenol level in plant tissue was determined using total ohenol colorimetric assay kit (E-BC-K354-M).
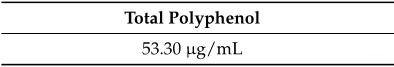
The concentration of total phenol was determined.
Dilution of Sample
It is recommended to take 2~3 samples with expected large difference to do pre-experiment before formal experiment and dilute the sample according to the result of the pre-experiment and the detection range (1.05-148 μg/mL).
The recommended dilution factor for different samples is as follows (for reference only):
| Sample type | Dilution factor |
| Epipremnum aureum tissue homogenate | 20-30 |
| Daucus carota tissue homogenate | 5-15 |
| Spinacia oleracea tissue homogenate | 15-25 |
| Leek tissue homogenate | 10-20 |
Note: The diluent is 60% alcohol.
Detection Principle
Plant total phenol is a common secondary natural metabolite in plants. There are several kinds of phenolic compounds, such as hydroxybenzoic acid, hydroxy cinnamic acid, flavonoids, chalcone, flavonoids, lignin, coumarin and astragalus. Phenolic compounds are antioxidants that delay or prevent oxidation and oxygen radical reactions.
Kit Components & Storage
| Item | Component | Size 1 (96 T) | Size 2 (500 Assays) | Storage |
| Reagent 1 | Chromogenic Reagent | 10 mL × 1 vial | 50 mL × 1 vial | 2-8°C, 12 months shading light |
| Reagent 2 | Alkali Reagent | Powder × 1 vial | Powder × 5 vials | 2-8°C, 12 months |
| Reagent 3 | Standard | Powder × 2 vials | Powder × 10 vials | 2-8°C, 12 months shading light |
| Microplate | 96 wells | No requirement | ||
| Plate Sealer | 2 pieces | |||
Note: The reagents must be stored strictly according to the preservation conditions in the above table. The reagents in different kits cannot be mixed with each other. For a small volume of reagents, please centrifuge before use, so as not to obtain sufficient amount of reagents.
Technical Data:
Parameter:
Intra-assay Precision
Three human serum samples were assayed in replicates of 20 to determine precision within an assay. (CV = Coefficient of Variation)
| Parameters | Sample 1 | Sample 2 | Sample 3 |
| Mean (μg/mL) | 5.70 | 35.40 | 106.20 |
| %CV | 4.5 | 4.2 | 3.6 |
Inter-assay Precision
Three human serum samples were assayed 20 times in duplicate by three operators to determine precision between assays.
| Parameters | Sample 1 | Sample 2 | Sample 3 |
| Mean (μg/mL) | 5.70 | 35.40 | 106.20 |
| %CV | 3.8 | 4.6 | 4.8 |
Recovery
Take three samples of high concentration, middle concentration and low concentration to test the samples of each concentration for 6 times parallelly to get the average recovery rate of 95%.
| Standard 1 | Standard 2 | Standard 3 | |
| Expected Conc. (μg/mL) | 25 | 76 | 114 |
| Observed Conc. (μg/mL) | 23.5 | 75.2 | 104.9 |
| Recovery rate (%) | 94 | 99 | 92 |
Sensitivity
The analytical sensitivity of the assay is 1.05 μg/mL. This was determined by adding two standard deviations to the mean O.D. obtained when the zero standard was assayed 20 times, and calculating the corresponding concentration.
Standard Curve
As the OD value of the standard curve may vary according to the conditions of the actual assay performance (e.g. operator, pipetting technique or temperature effects), so the standard curve and data are provided as below for reference only:
| Concentration (μg/mL) | 0 | 20 | 40 | 60 | 80 | 100 | 120 | 150 |
| OD value | 0.050 | 0.150 | 0.251 | 0.354 | 0.458 | 0.564 | 0.642 | 0.817 |
| 0.050 | 0.161 | 0.255 | 0.367 | 0.462 | 0.569 | 0.650 | 0.783 | |
| Average OD | 0.050 | 0.155 | 0.253 | 0.360 | 0.460 | 0.567 | 0.646 | 0.800 |
| Absoluted OD | 0.000 | 0.105 | 0.203 | 0.311 | 0.411 | 0.517 | 0.596 | 0.750 |