Total Price: $0.00
Contact Information


Glucose (Glu) Colorimetric Assay Kit (GOD-POD Method)
SKU: E-BC-K234-S-100
Glucose (Glu) Colorimetric Assay Kit (GOD-POD Method)
| SKU # | E-BC-K234-S |
| Detection Instrument | Spectrophotometer (505 nm) |
| Detection method | Colorimetric method |
Product Details
Properties
| Synonyms | Glu |
| Sample Type | Serum, plasma |
| Sensitivity | 0.05 mmol/L |
| Detection Range | 0.05-30 mmol/L |
| Detection Method | Colorimetric method |
| Assay type | Quantitative |
| Assay time | 60 min |
| Precision | Average inter-assay CV: 1.300% | Average intra-assay CV: 1.200% |
| Other instruments required | Vortex mixer, Micropipettor, Incubator |
| Other reagents required | Normal saline (0.9% NaCl) |
| Storage | 2-8℃ |
| Valid period | 12 months |
Images
ZJ Zhao et al investigate the effect of ambient temperature on energy balance. Glucose (Glu) level in mouse serum was determined using glucose colorimetric assay kit (E-BC-K234-S).
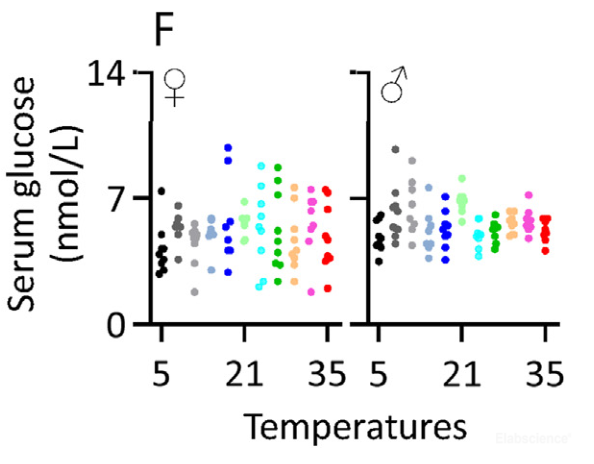
No significant change of serum glucose can be observed with the change of temperature.
Dilution of Sample
It is recommended to take 2~3 samples with expected large difference to do pre-experiment before formal experiment and dilute the sample according to the result of the pre-experiment and the detection range (0.05-30 mmol/L).
The recommended dilution factor for different samples is as follows (for reference only):
| Sample type | Dilution factor |
| Rat plasma | 1 |
| Mouse serum | 1 |
| Human serum | 1 |
| Human plasma | 1 |
Note: The diluent is normal saline (0.9% NaCl).
Detection Principle
Glucose oxidase can catalyze the oxidation of glucose to gluconic acid to produce hydrogen peroxide. In the presence of chromogenic oxygen receptors, peroxidase catalyzes hydrogen peroxide and oxidizes pigment sources to form colored substances. Measure the OD value at 505 nm and glucose content can be calculated indirectly.
Kit Components & Storage
| Item | Component |
Size 1 (50 assays) |
Size 2 (100 assays) |
Storage |
| Reagent 1 | Phenol Solution | 60 mL × 1 vial | 60 mL × 2 vials | 2-8°C, 12 months, shading light |
| Reagent 2 | Enzyme Solution | 60 mL × 1 vial | 60 mL × 2 vials | 2-8°C, 12 months, shading light |
| Reagent 3 | 50 mmol/L Glucose Standard | 1 mL × 1 vial | 1 mL × 1 vial | 2-8℃, 12 months |
Note: The reagents must be stored strictly according to the preservation conditions in the above table. The reagents in different kits cannot be mixed with each other. For a small volume of reagents, please centrifuge before use, so as not to obtain sufficient amount of reagents.
Technical Data:
Parameter:
Intra-assay Precision
Three human serum samples were assayed in replicates of 20 to determine precision within an assay. (CV = Coefficient of Variation)
| Parameters | Sample 1 | Sample 2 | Sample 3 |
| Mean (mmol/L) | 2.60 | 18.40 | 25.70 |
| %CV | 1.5 | 1.3 | 0.8 |
Inter-assay Precision
Three human serum samples were assayed 17 times in duplicate by three operators to determine precision between assays.
| Parameters | Sample 1 | Sample 2 | Sample 3 |
| Mean (mmol/L) | 2.60 | 18.40 | 25.70 |
| %CV | 1.0 | 1.4 | 1.5 |
Recovery
Take three samples of high concentration, middle concentration and low concentration to test the samples of each concentration for 6 times parallelly to get the average recovery rate of 101%.
| Sample 1 | Sample 2 | Sample 3 | |
| Expected Conc. (mmol/L) | 4.5 | 15 | 22 |
| Observed Conc. (mmol/L) | 4.5 | 15.5 | 22.2 |
| Recovery rate (%) | 99 | 103 | 101 |
Sensitivity
The analytical sensitivity of the assay is 0.05 mmol/L. This was determined by adding two standard deviations to the mean O.D. obtained when the zero standard was assayed 20 times, and calculating the corresponding concentration.
Standard Curve
As the OD value of the standard curve may vary according to the conditions of the actual assay performance (e.g. operator, pipetting technique or temperature effects), so the standard curve and data are provided as below for reference only:
| Concentration (mmol/L) | 0 | 2 | 5 | 10 | 15 | 20 | 30 |
| Average OD | 0.007 | 0.128 | 0.310 | 0.598 | 0.912 | 1.212 | 1.792 |
| Absoluted OD | 0 | 0.121 | 0.303 | 0.591 | 0.905 | 1.205 | 1.785 |