Total Price: $0.00
Contact Information


Glutathione-S-Transferase (GST) Activity Assay Kit
SKU: E-BC-K278-S-100
To better serve you, we would like to discuss your specific requirement.
Please Contact Us for a quote.
Glutathione-S-Transferase (GST) Activity Assay Kit
| SKU # | E-BC-K278-S |
| Detection Instrument | Spectrophotometer(340 nm) |
| Detection method | Colorimetric method |
Product Details
Properties
| Synonyms | GSH-ST |
| Sample type | Serum, plasma, tissue, cells |
| Sensitivity | 1 U/L |
| Detection range | 1-79 U/L |
| Detection Method | Colorimetric method |
| Assay type | Enzyme Activity |
| Assay time | 50min |
| Precision | Average inter-assay CV: 4.300% | Average intra-assay CV: 1.900% |
| Other instruments required | Micropipettor, Incubator, Vortex mixer |
| Storage | 2-8℃ |
| Valid period | 12 months |
Images
Y Du et al investigate the mechanism of Yu Ping Feng San in tracking the cisplatin-resistacne. Glutathione-S-Transferase (GST) avtivity in human cell was determined using GST activity assay kit (E-BC-K278-S).
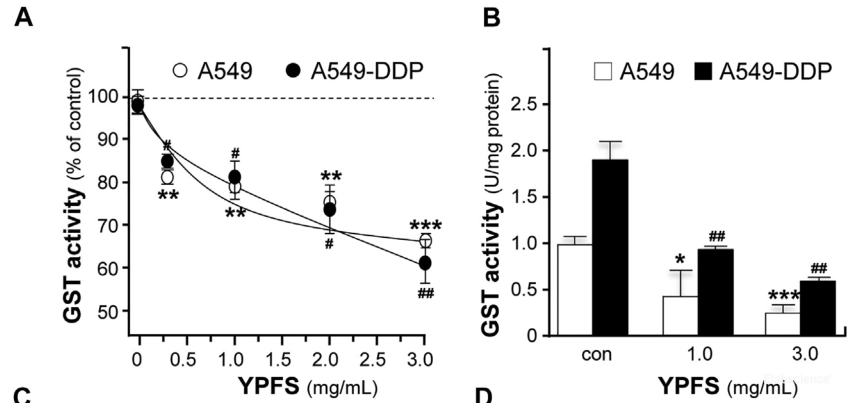
GST activity was inhibited by adding in YPFS. (#P<0.05, ##P<0.01, *P<0.05, **P<0.01, ***P<0.001)
Dilution of Sample
It is recommended to take 2~3 samples with expected large difference to do pre-experiment before formal experiment and the results of the samples are linear within 5 min.
The recommended dilution factor for different samples is as follows (for reference only):
| Sample type | Dilution factor |
| Human serum (plasma) | 1 |
| 10% Rat liver tissue homogenate | 150-200 |
| 10% Rat lung tissue homogenate | 8-12 |
| 10% Rat kidney tissue homogenate | 10-15 |
| 10% Plant tissue homogenate | 1 |
Note: The diluent is double distilled water or reagent 1.
Detection Principle
GST can catalyze the binding of reduced glutathione (GSH) to dinitrobenzene (CDNB) and the product have an absorption peak at 340 nm. The activity of GSH-ST can be calculated by measuring the increasing rate of absorbance at 340 nm.
Kit Components & Storage
| Item | Component |
Size 1 (50 assays) |
Size 2 (100 assays) |
Storage |
| Reagent 1 | Extracting Solution | 60 mL × 1 vial | 60 mL × 2 vials | 2-8°C, 12 months |
| Reagent 2 | Buffer Solution | 50 mL × 1 vial | 50 mL × 2 vials | 2-8°C, 12 months |
| Reagent 3 | Powder | Powder ×1 vial | Powder ×2 vials | 2-8°C, 12 months |
Note: The reagents must be stored strictly according to the preservation conditions in the above table. The reagents in different kits cannot be mixed with each other. For a small volume of reagents, please centrifuge before use, so as not to obtain sufficient amount of reagents.
Technical Data:
Parameter:
Intra-assay Precision
Three human serum samples were assayed in replicates of 20 to determine precision within an assay. (CV = Coefficient of Variation)
| Parameters | Sample 1 | Sample 2 | Sample 3 |
| Mean (U/L) | 5.60 | 24.50 | 52.30 |
| %CV | 2.3 | 1.8 | 1.6 |
Inter-assay Precision
Three human serum samples were assayed 17 times in duplicate by three operators to determine precision between assays.
| Parameters | Sample 1 | Sample 2 | Sample 3 |
| Mean (U/L) | 5.60 | 24.50 | 52.30 |
| %CV | 4.2 | 4.3 | 4.4 |
Recovery
Take three samples of high concentration, middle concentration and low concentration to test the samples of each concentration for 6 times parallelly to get the average recovery rate of 105%.
| Parameters | Sample 1 | Sample 2 | Sample 3 |
| Expected Conc. (U/L) | 12.6 | 32.5 | 65 |
| Observed Conc. (U/L) | 13.0 | 33.8 | 70.2 |
| Recovery rate (%) | 103 | 104 | 108 |
Sensitivity
The analytical sensitivity of the assay is 1 U/L. This was determined by adding two standard deviations to the mean O.D. obtained when the zero standard was assayed 20 times, and calculating the corresponding concentration.
Standard Curve
As the OD value of the standard curve may vary according to the conditions of the actual assay performance (e.g. operator, pipetting technique or temperature effects), so the standard curve and data are provided as below for reference only:
| Time (min) | 0 | 1 | 2 | 3 | 4 | 5 |
| Average OD | 0.041 | 0.096 | 0.146 | 0.191 | 0.233 | 0.276 |